Indianext
No Result
View All Result
Subscribe
  • News
    • Project Watch
    • Policy
  • AI Next
  • People
    • Interviews
    • Profiles
  • Companies
  • Make In India
    • Solutions
    • State News
  • About Us
    • Editors Corner
    • Mission
    • Contact Us
    • Work Culture
  • Events
  • Guest post
  • News
    • Project Watch
    • Policy
  • AI Next
  • People
    • Interviews
    • Profiles
  • Companies
  • Make In India
    • Solutions
    • State News
  • About Us
    • Editors Corner
    • Mission
    • Contact Us
    • Work Culture
  • Events
  • Guest post
No Result
View All Result
Latest News on AI, Healthcare & Energy updates in India
No Result
View All Result
Home TOP 10

10 Must-Know Data Visualization Methods For 2023

October 27, 2023
Data visualization

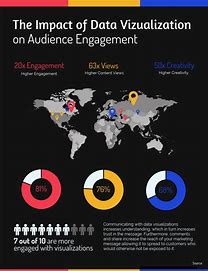
Data visualization is an essential component in a society where information is abundant because it may successfully direct us toward making well-informed judgments. By using data visualization tools and methodologies, we may extract useful information that aids in problem-solving for both individuals and enterprises. The following ten data visualization methods are ones you should be aware of:

Interactive Visualizations: Real-time data exploration and interaction are made possible by interactive data visualizations, which also aid in improving user comprehension. It’s more than just a still picture. To obtain more information from an interactive visualization, we can click, hover over, or otherwise interact with it. They frequently include features like drill-down menus, filters, and tooltips. Based on the insights we have from using it, interactive data visualization assists us in making more informed decisions.

Artificial Intelligence: To automate the data visualization process, individuals are turning to artificial intelligence and machine learning these days. People can study large data sets and create intricate models that employ natural language processing (NLP) and data mining skills when AI and data visualization are combined. AI also makes recommendations for appropriate visualizations depending on the context and material.

Virtual reality (VR) and augmented reality (AR): AR and VR technologies are being utilized to provide immersive data visualizations, especially in the training, education, and gaming industries. 360-degree virtual environments are a useful tool for data scientists to build realistic and incredibly accurate models of complex datasets. Multiple data dimensions can be included in these models, which facilitates comprehension for average individuals. Similar to this, augmented reality (AR) is employed to improve real-world encounters with digital information and visualize data. These methods can offer a special method for examining intricate data.

Infographics: Infographics and data art combine creative design with data visualization. It functions similarly to a visual aid for explaining complicated ideas or concepts to others. Infographics consist of brief graphs, charts, and eye-catching text accompanied by images. To convey messages that are powered by facts, they frequently employ imaginative and eye-catching components. It improves the attractiveness and comprehension of the information or message.

Streamgraphs: A type of stacked area graphic used to show how data has changed over time. When you have several sets of data that overlap or stack on top of one another, it’s useful. It represents each dataset using colorful layers as opposed to conventional lines or bars. To illustrate how the data evolves, each layer begins at a similar baseline and travels up and down. In this approach, you can quickly and visually monitor how various data sets change over time.

Real-time Dashboards: A real-time dashboard displays data that is updated in real-time, much like a live report. It displays current information and is simultaneously visible to a large number of users. With its up-to-date information, it’s helpful for tracking data that is always changing, such as stock prices or website traffic. Dashboards that continuously refresh are becoming more widespread as real-time data becomes more accessible. These dashboards find application in domains such as social media monitoring, IoT, and finance.

Data storytelling: Creating narrative-driven dashboards that lead the user through the data is known as data storytelling. Data dashboards that tell stories make data easier to comprehend and extract insights from. These methods contribute to the relatability and engagement of data.

Small Multiple Visualizations: To compare several datasets or time periods, a grid of tiny, comparable charts or graphs is created. They aid with the rapid identification of distinctions and patterns.

Data sonification: It is a technique that involves utilizing sound to represent data. While data visualization uses visual cues to help you understand information, data sonification uses auditory cues to do the same thing. It’s a new method that has potential for helping those who are visually impaired communicate information.

Explanatory Data Visualization: This type of data visualization aims to lead the user through the data and provide a concise, intelligible explanation of the insights. In journalism and data-driven storytelling, they are frequently utilized.

Leave a Reply Cancel reply

Your email address will not be published. Required fields are marked *

Editors Corner

How can Artificial Intelligence tools be a blessing for recruiters?

Will Artificial Intelligence ever match human intelligence?

Artificial Intelligence: Features of peer-to-peer networking

What not to share or ask on Chatgpt?

How can Machine Learning help in detecting and eliminating poverty?

How can Artificial Intelligence help in treating Autism?

Speech Recognition and its Wonders in your corporate life

Most groundbreaking Artificial Intelligence-based gadgets to vouch for in 2023

Recommended News

AI Next

Google: AI From All Perspectives

Alphabet subsidiary Google may have been slower than OpenAI to make its AI capabilities publicly available in the past, but...

by India Next
May 31, 2024
AI Next

US And UK Doctors Think Pfizer Is Setting The Standard For AI And Machine Learning In Drug Discovery

New research from Bryter, which involved over 200 doctors from the US and the UK, including neurologists, hematologists, and oncologists,...

by India Next
May 31, 2024
Solutions

An Agreement Is Signed By MEA, MeitY, And CSC To Offer E-Migration Services Via Shared Service Centers

Three government agencies joined forces to form a synergy in order to deliver eMigrate services through Common Services Centers (CSCs)...

by India Next
May 31, 2024
AI Next

PR Handbook For AI Startups: How To Avoid Traps And Succeed In A Crowded Field

The advent of artificial intelligence has significantly changed the landscape of entrepreneurship. The figures say it all. Global AI startups...

by India Next
May 31, 2024

Related Posts

data-science
TOP 10

The Top 10 Blogs On Data Science To Read In 2024

May 30, 2024
Artificial-Intelligence
TOP 10

The Top 10 AI Technologies That Are Changing the Business World

May 27, 2024
artificial-intelligence
TOP 10

10 AI Projects To Display Your Skills And Originality

May 25, 2024
Robotics
TOP 10

The Top 10 Competencies Required For Robotics Success

May 24, 2024
Load More
Next Post
meme coin

The Top 5 Meme Coins That Could Beat Dogecoin By 2024

IndiaNext Logo
IndiaNext Brings you latest news on artificial intelligence, Healthcare & Energy sector from all top sources in India and across the world.

Recent Posts

Google: AI From All Perspectives

US And UK Doctors Think Pfizer Is Setting The Standard For AI And Machine Learning In Drug Discovery

An Agreement Is Signed By MEA, MeitY, And CSC To Offer E-Migration Services Via Shared Service Centers

PR Handbook For AI Startups: How To Avoid Traps And Succeed In A Crowded Field

OpenAI Creates An AI Safety Committee Following Significant Departures

Tags

  • AI
  • EV
  • Mental WellBeing
  • Clean Energy
  • TeleMedicine
  • Healthcare
  • Electric Vehicles
  • Artificial Intelligence
  • Chatbots
  • Data Science
  • Electric Vehicles
  • Energy Storage
  • Machine Learning
  • Renewable Energy
  • Green Energy
  • Solar Energy
  • Solar Power

Follow us

  • Facebook
  • Linkedin
  • Twitter
© India Next. All Rights Reserved.     |     Privacy Policy      |      Web Design & Digital Marketing by Heeren Tanna
No Result
View All Result
  • About Us
  • Activate
  • Activity
  • Advisory Council
  • Archive
  • Career Page
  • Companies
  • Contact Us
  • cryptodemo
  • Energy next
  • Energy Next Archive
  • Home
  • Interviews
  • Make in India
  • Market
  • Members
  • Mission
  • News
  • News Update
  • People
  • Policy
  • Privacy Policy
  • Register
  • Reports
  • Subscription Page
  • Technology
  • Top 10
  • Videos
  • White Papers
  • Work Culture
  • Write For Us

Welcome Back!

Login to your account below

Forgotten Password?

Retrieve your password

Please enter your username or email address to reset your password.

Log In

Add New Playlist

IndiaNext Logo

Join Our Newsletter

Get daily access to news updates

no spam, we hate it more than you!